To Switch or Not? Simulating the Monty-Hall Problem

The Monty-Hall problem is perhaps one the most well-known examples of a situation when arguments about matters of chance and probability make it into the general public discourse. Initially proposed and solved by Steve Selvin in a letter to the editor of the The American Statistician, the problem became known more broadly when the correctness of the perhaps slightly unintuitive solution became the subject of a bitter public disagreement between a famous American columnist (and mathematician, Marilyn vos Savant) and (some of) her more distinguished readers.
Here’s a reproduction of the problem originally posed (and solved) in Selvin’s letter. The set-up can be summarised as follows:
There is a prize hidden behind 1 of 3 doors. A contestant can select a door at random with a 1/3 chance of winning. Once the selection is made, the eponymous Monty Hall reveals what’s behind one of the remaining doors but the catch is that he must not reveal the winning choice. Now, the contestant must decide – stick to the original selection or switch to the remaining door. What would you do?
The Simple Solution
Using enumeration to solve the problem, we could describe the various possibilities in such a game with the decision matrix below. Clearly, the odds of winning when a player switches are 2/3 or about 66.67%.
| Prize Behind | Player Chooses | Monty Reveals | Player Switches | Outcome |
|---|---|---|---|---|
| Door A | Door A | Door B or C | A -> B or C | Loser |
| Door A | Door B | Door C | B -> A | Winner |
| Door A | Door C | Door B | C -> A | Winner |
| Door B | Door A | Door C | A -> B | Winner |
| Door B | Door B | Door A or C | B -> A or C | Loser |
| Door B | Door C | Door A | C -> B | Winner |
| Door C | Door A | Door B | A -> C | Winner |
| Door C | Door B | Door A | B -> C | Winner |
| Door C | Door C | Door A or B | C -> A or B | Loser |
Simulating the Problem with some R Code
Simulating this problem is a fun way to understand how functions and loops work in R and can be a good way for students to grasp concepts around simulating probabilistic scenarios.
# Define f() to simulate n runs of the Monty-Hall problem given our strategy
monty_hall <- function(strategy = "switch", n = 100) {

  # Initialise doors and wins
  doors <- 1:3
  wins <- 0

  for (i in 1:n) {

    # Winning door
    winning_door <- floor(runif(1, 1, 4))
    # Initial guess
    my_guess <- floor(runif(1, 1, 4))

    # Monty reveals a losing door
    monty_opens <- ifelse(
      winning_door == my_guess,
      sample(doors[-c(winning_door)]),
      doors[-c(winning_door, my_guess)]
    )

    # Final Player Selection
    my_selection <- if(strategy == "stick") {
      my_guess
    } else if(strategy == "switch") {
      doors[-c(my_guess, monty_opens)]
    } else if(strategy %in% c("", "random", "both")) {
      sample(c(doors[-c(my_guess, monty_opens)], my_guess), 1)
    } else {
      print("Please select a valid strategy.")
    }

    outcome <- ifelse(winning_door == my_selection, "Winner", "Loser")
    wins <- ifelse(outcome == "Winner", wins+1, wins)
    losses <- n-wins
    win_rate = wins / n

  }

  # A tibble to store outomes
  tidyr::tibble(strategy, trials = n, wins, losses, win_rate)

}
We can now use our function to generate data for any n, under different strategies. Let’s plot the results from our simulation and see which strategy wins in the long-run.
# For plotting
library(ggplot2)

# Initialise a tibble to store results
out <- tidyr::tibble()
# Generate data from our simulation
for (i in 1:1000) {
  out <- dplyr::bind_rows(
    out, do.call(
      rbind, lapply(c("switch", "stick", "random"), function(x) monty_hall(x, n = i))
    )
  )
}

# Plot results
ggplot(aes(trials, win_rate), data = out) +
  geom_line(aes(col = strategy)) +
  scale_y_continuous(label = scales::percent_format()) +
  ggtitle("No. of Games v/s Win-Rate") +
  xlab("Number of Times the Game is Played") +
  ylab("% of Games Where Player Wins") +
  theme_bw() +
  theme(text = element_text(size = 15, face = "bold"),
        plot.title = element_text(hjust = .5))
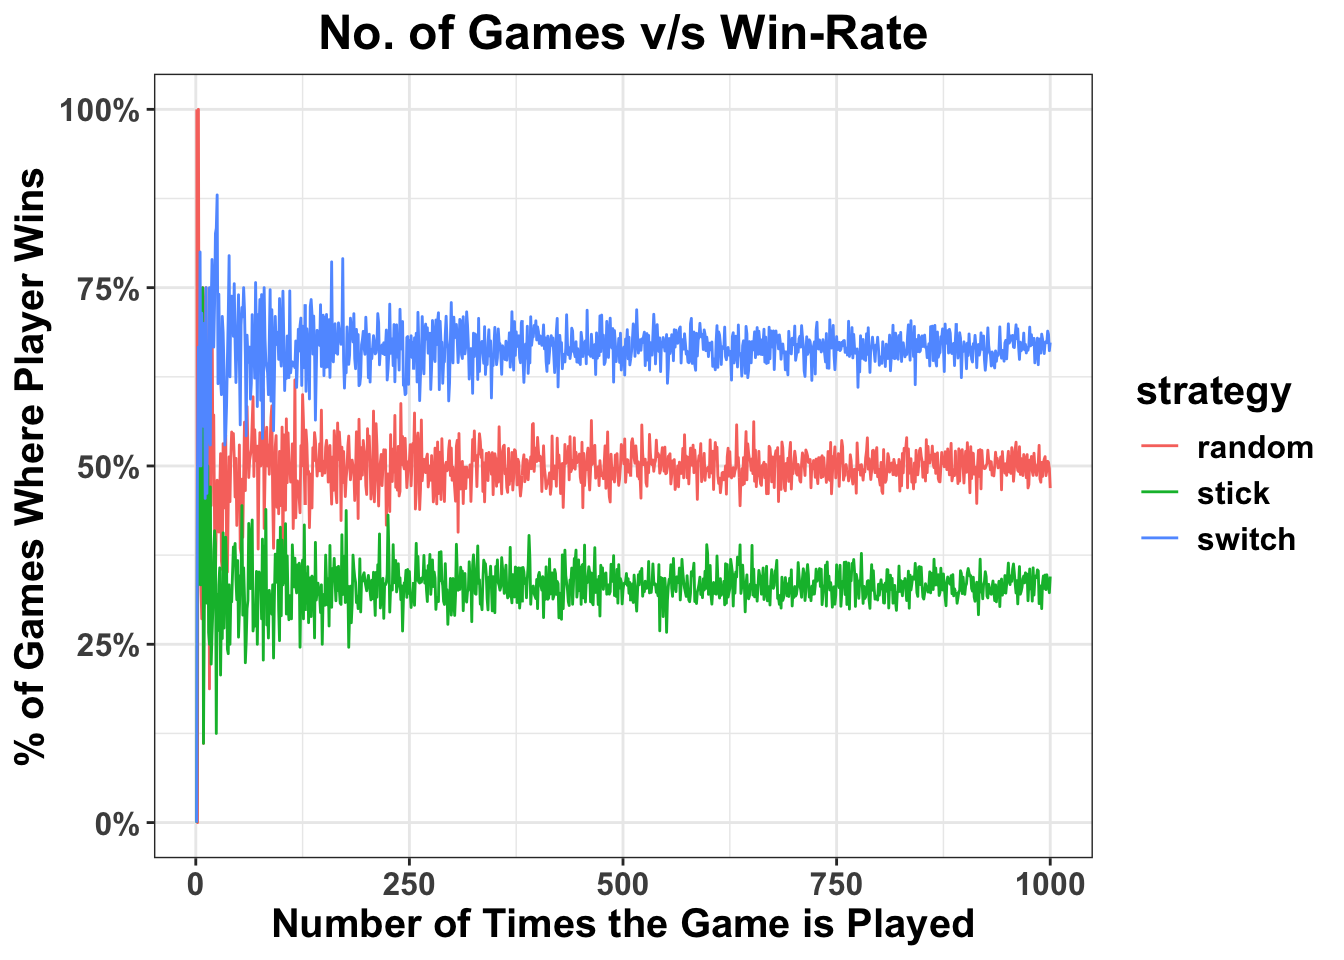
It would seem that we have a winner! Clearly, switching doors is the dominating strategy vindicating vos Savant’s perhaps not so controversial solution.
Try working with the code on your own machine and messing with some parameters? What happens to the odds when we change the number of doors to 4 or more and how might we set sup a similar experiment?
Shashwat M. Pande
Data, Models, Decisions.
My research interests include behavioural decision-making, experiment design, data science and interactions between humans, models and decision-making environments involving risk, uncertainty and/or ambiguity.